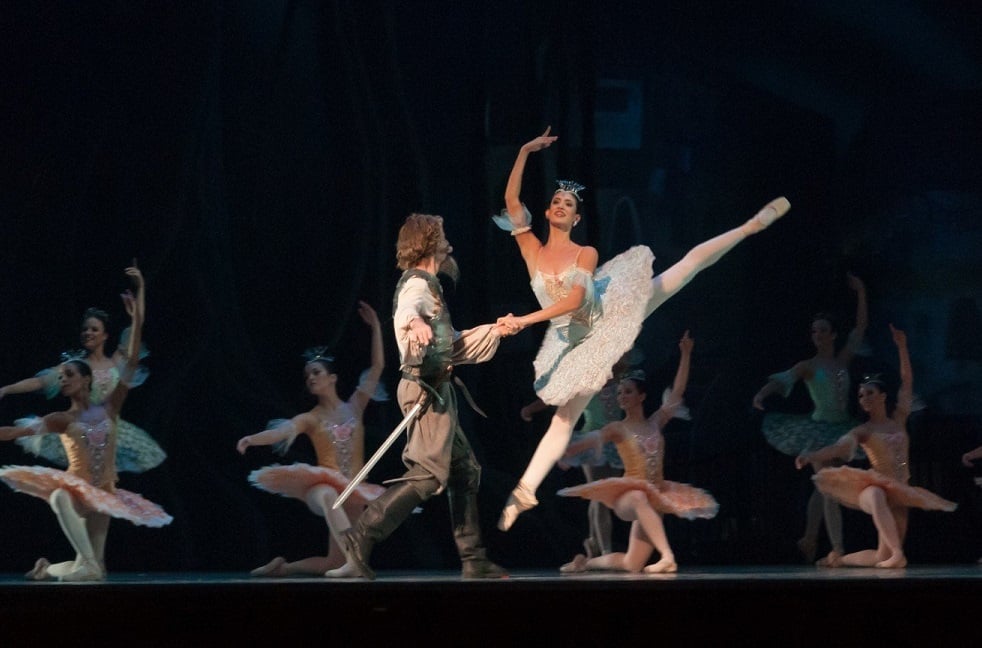
Audiences for ballet are primarily drawn from less deprived areas
What do we really know about audience privilege?
Research suggests that people living in ‘more deprived’ areas are less likely to engage with cultural activity. But is that true across the board, or are there different patterns between – and within – different art forms? Mark Taylor digs deep to find out.
Relative to the nation, arts audiences are disproportionately white, middle class, middle aged, and highly educated. But the statistics used to inform this observation tend to be blunt. Just because data suggest that dance performances are an example of this pattern, does it follow that the audiences for classical ballet and contemporary dance are the same as each other?
Beyond this, we often hear scepticism about the validity of using surveys to find out about audiences in the first place, because most people aren’t willing to complete them. Is it simply the people who fill in questionnaires, rather than the audiences in general, who are the privileged group?
…in most cases, the story of arts audiences remains a story of inequality
To investigate these two questions we need to know whether the profile of who’s going to different events is similar across survey datasets and ticketing data. If the story from surveys about who’s going to events is radically different from the story from box offices, that might suggest issues with survey sources. But if they’re similar, it suggests representativeness.
In a recent paper, we compared The Audience Agency’s Audience Finder – which reveals actual behaviour and is based on box office data – with national survey data sources Active Lives and Taking Part. We found that the areas where people are buying more tickets are also the areas where people are saying they’re attending more events.

We then built on this analysis by investigating the distributions of ticket sales and survey responses across the indices of multiple deprivation (IMD). These give an indication of deprivation across small areas across England (a value of 1 indicates that an area is among the 10% most deprived areas in the country, and 10 indicates it’s among the 10% least deprived). While they’re not perfect — not everyone who lives in an area classified as ‘more deprived’ is deprived themselves — they’re helpful. They’re also useful when we’re analysing ticketing data, as where people live can reveal a huge amount about them.

Here, we’ve shown three examples – you can find many more in the paper. We found that for some activities, such as plays and classical music, the survey data and box office data show very similar patterns: the percentages of people saying they attend these are essentially (within the margin of error) confirmed by the ticketing data.
But for other activities, the numbers are quite different. In many cases, this reflects activities that tend not to be ticketed, such as art exhibitions. It makes sense that the audiences for ticketed arts exhibitions might not be very similar to the audiences for art exhibitions where entry is free. In addition, for activities such as contemporary dance, the fraction of the population attending is so small that the estimates based on the survey data may not be very reliable.
But this analysis only gets us half way. It reassures us that survey data sources and ticketing data sources tell the same story, so long as we’re looking at activities that are widely ticketed and reasonably widely attended.
Profiles within art forms
So what can ticketing data tell us about activities that aren’t widely-attended? To answer that, we focused particularly on dance and literary events and used Audience Finder’s classifications of activities within each of these two broader groups.

Again, we’ve focused on a few key examples here. It’s unlikely to surprise ArtsProfessional readers that audiences for ballet are primarily drawn from less deprived areas — and that the social stratification of ballet looks almost identical for traditional and contemporary forms. What might be more surprising is that, except in the most deprived 10% of areas, the audience for contemporary dance is far more mixed than almost any other art form.
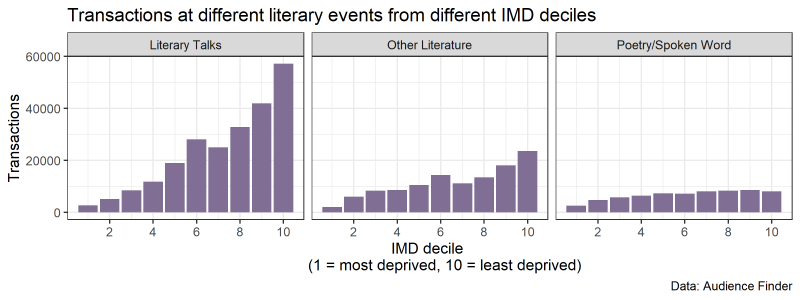
Literary talks — the genre that dominates the category of literary events — is overwhelmingly dominated by people from the least deprived areas of the country. 21 times as many tickets are sold in the least deprived 10% of areas of the country as in the most deprived 10% of areas. Poetry and spoken word is the most socially mixed form of literary events, though this category is still socially stratified, it’s just that this stratification pales in comparison with that of other varieties of literary events.
We also looked into how these patterns vary between venues that are part of Arts Council England’s national portfolio, and those that aren’t. In dance, NPOs were slightly less socially stratified and these venues seem to be attracting a more mixed crowd. For literary events, it was the opposite: Arts Council-supported venues were even more socially exclusive in their audiences than other venues.
The same old story
This analysis shows that ticketing data is powerful for unpacking inequalities across and within different art forms, and its value is most evident in understanding niche activities that survey methods can struggle to estimate. But this is not to say that we should only use ticketing data to understand social inequality in the arts. There’s plenty that survey work is more suitable for, particularly around understanding differences beyond social deprivation.
The most important story of all though is one around social inequality in general. Whether you measure audiences through ticketing data or survey data, whether you go more in-depth or more macro, in most cases, the story of arts audiences remains a story of inequality.
Mark Taylor is Senior Lecturer in Quantitative Methods (Sociology) at the Sheffield Methods Institute, University of Sheffield, and AHRC Leadership Fellow (Creative Economy).
https://www.sheffield.ac.uk/smi
This article is based on research published in more detail in ‘The coming crisis of cultural engagement? Measurement, methods, and the nuances of niche activities’, Cultural Trends, Vol 28 2019 – Issue 2-3.
Join the Discussion
You must be logged in to post a comment.