Florence and the machine
How can the arts sector unlock the power of big data? Jason Jones-Hall suggests we learn from the work of Florence Nightingale, not always known as a brilliant statistician.
Innovation and disruption are part of our daily lives and we are told it’s all thanks to the wonders of modern technology. The truth is that it is people who drive innovation and disruption and not tech. Look behind every big breakthrough and you will invariably find a visionary maverick with brilliant ideas and a burning desire to tear down a few walls.
This is the inspiration behind the xHumed project to bring back ‘dead good thinkers’ from the past, to present a visionary talk in their own words on what we think of as contemporary themes. Sort of a dead TED.
Look behind every big breakthrough and you will invariably find a visionary maverick with brilliant ideas and a burning desire to tear down a few walls
Take big data and the modern trend of data visualisation. Ever-faster computers process massive amounts of data at lightning-fast speeds. But we’ve been here before. If we go back more than 150 years, the invention of the steam printing press and railways also allowed rapid collation and communication of data. And one woman, in particular, developed creative strategies to harness its power.
Known now as the founder of modern nursing, Florence Nightingale was a brilliant statistician who can teach us all we need to know to unlock the power of big data and visualisation in seven simple steps.
1. Create order from chaos
When Nightingale arrived in the Crimea, she found utter chaos in the hospital at Scutari. This extended beyond the working conditions and lack of sanitation as the medical records were also in a deplorable state. Each hospital had its own system of classifying and recording diseases and many deaths were not recorded at all.
We may not be facing life and death situations, but trends analysis in the cultural sector requires a similarly consistent and cohesive approach to data collection if it is to have any real value or meaning.
2. Develop a data strategy
Nightingale’s plans to keep statistics in a uniform scheme across all hospitals to allow comparative studies were endorsed by the International Statistical Congress in 1860 and by London and Parisian hospitals in the following year.
Traditionally, the cultural sector has tended to collate data based on an ‘accountability paradigm’. We collect the data that funders demand rather than seeing it as an asset in its own right. This is changing. Developing a data strategy that fits your needs while also being valuable in the bigger picture is key. Think about what data you capture, how you capture it, store it and what it might be used for.
3. Communicate complex information
Nightingale realised that in order to effect real change, she needed to make sure her data meant something to those who did not otherwise understand statistics or the specifics of working conditions in hospitals (particularly those in Parliament). She brought her data to life using visualisations.
As with any other form of communication, thinking about the audience is key. Today, data visualisations are used commonly to communicate complex information to funders and stakeholders, audiences, visitors and even as artistic works in their own right.
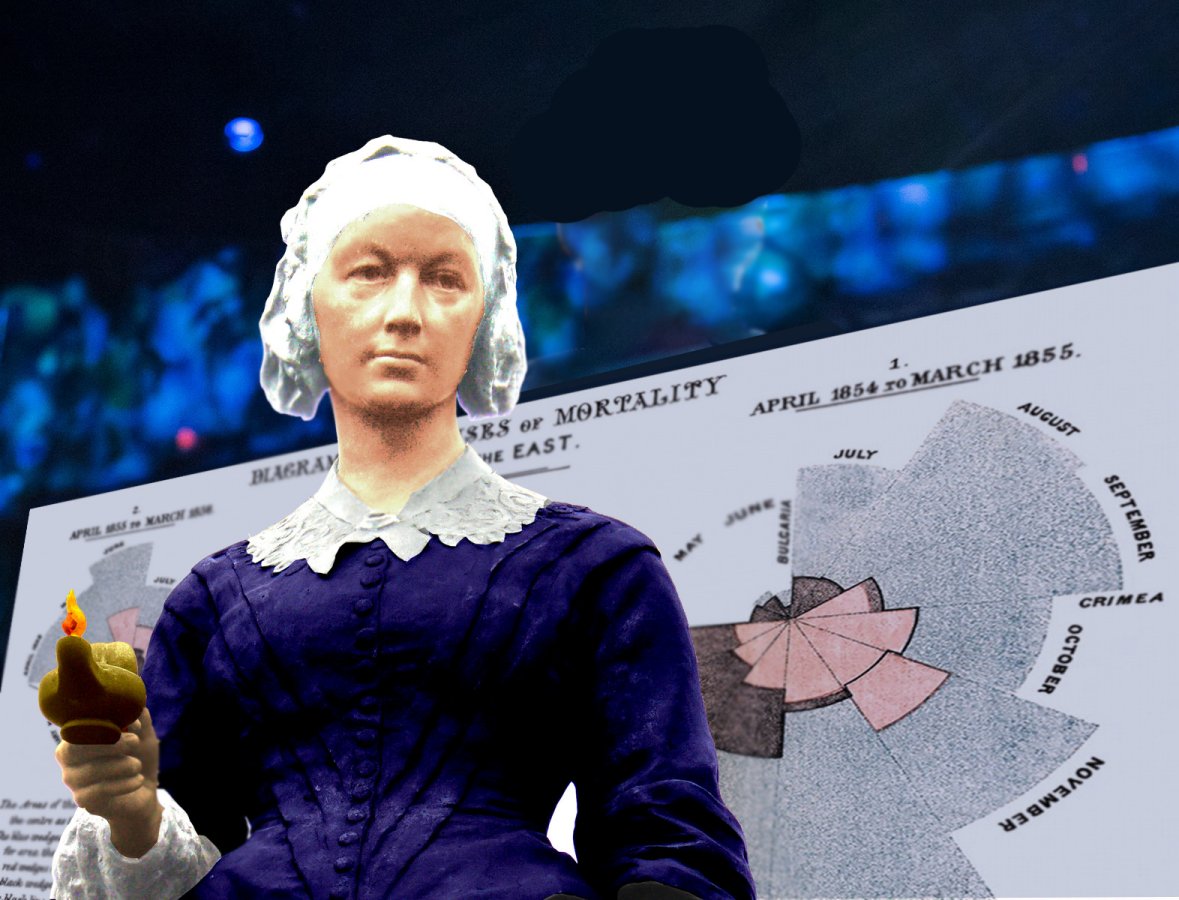
4. Experiment with visual styles
Different datasets may require different styles of visual representation. Nightingale is credited as having pioneered the use of the polar chart to visualise mortality rates in the Crimea.
There are lots of different ways to present data and a growing number of agencies and freelancers specialising in this field. Alternatively, there are tools available on the internet.
5. Tell stories with data
Crimean data revealed that during the war more troops died from disease and unsanitary living conditions than in London during the plague of 1665. Later on, Nightingale demonstrated that three times as many soldiers died at home and abroad during peacetime than when they were at war because of overcrowding and filth in the industrialised cities.
Such comparisons create stories and magnify the impact of raw data on its own. Think about what other datasets you can bring into play to create compelling stories.
6. Collaborate
The statistical data Nightingale collected during the Crimean war was later analysed with the help of William Farr, Britain’s foremost statistician at the time. Nightingale and Farr collaborated for the analysis of the army reform returns of death and on tactics for using mortality statistics as argumentative tools.
You may not be the greatest statistician, mathematician, data scientist or illustrator, but perhaps you can work with someone who is.
7. Enable change
Florence Nightingale became a passionate campaigner to improve health conditions in the British army, in hospitals in general and, latterly, in private housing. Her skill as a statistician – and in using all the tools and tricks above – were instrumental in these aims.
The resulting healthcare and legislative reforms are variously credited with cutting military mortality rates by more than two thirds and extending life expectancy by as much as 20 years.
Technology is a tool like any other. Data can fuel it. Together, remarkable things are possible. It’s up to you to decide where to take it.
Jason Jones-Hall is the Director of Five10Twelve Ltd.
fivetentwelve.com
Tw: @xHumedDGT
Join the Discussion
You must be logged in to post a comment.